What is a storm footprint in catastrophe claims?
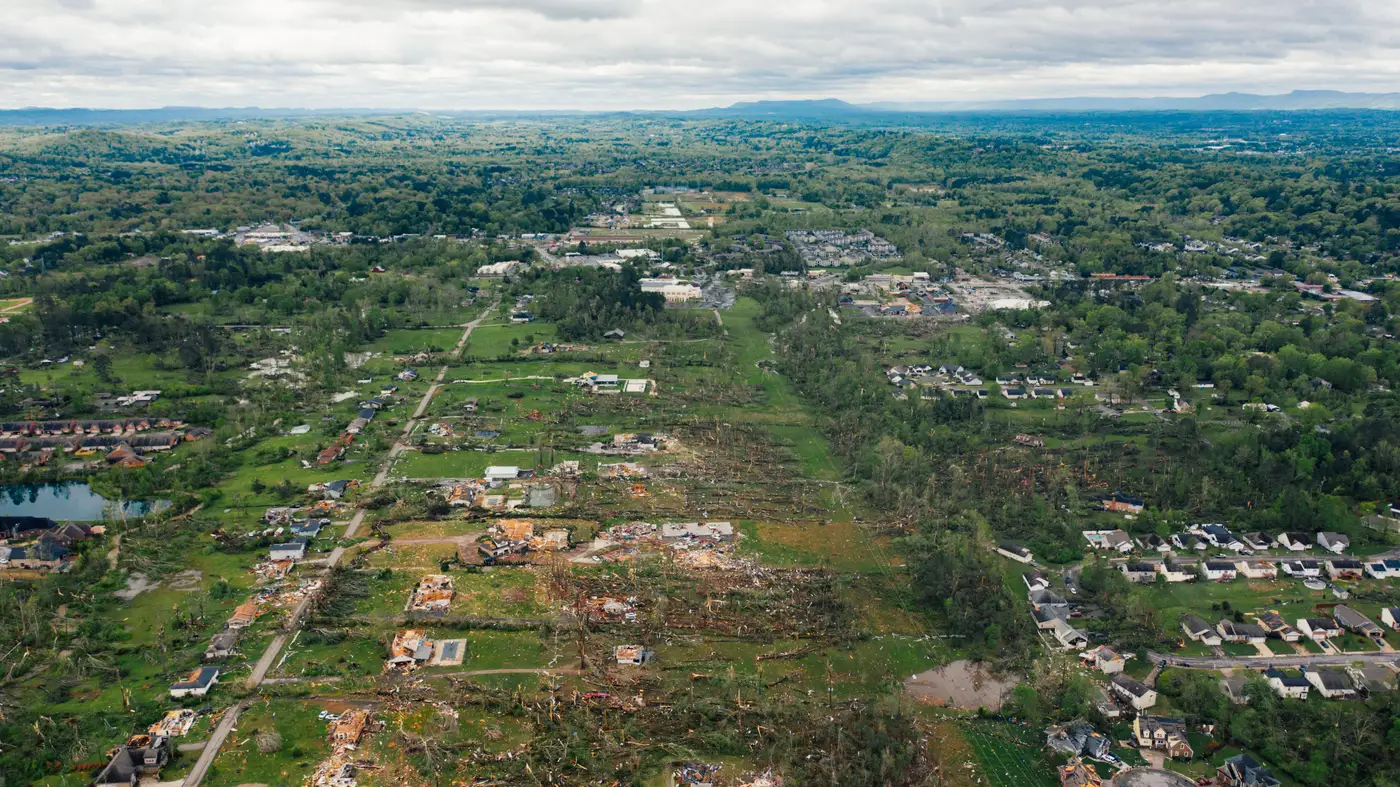
A storm footprint is the geographic shape of where a windstorm did real damage, as opposed to the county list or ZIP codes your catastrophe model spits out an hour after landfall. It's drawn from the storm's wind field, usually a swath of varying intensity that runs along the track and tapers off at the edges, not a neat polygon that matches jurisdictional lines. When your reserving team asks "what's the footprint on this one," they're asking for that shape, because the shape is what tells you how many claims are coming and from where.
Confusing a footprint with an administrative boundary is an easy mistake and an expensive one. A county can straddle the eyewall on one side and sit forty miles from any damaging wind on the other. If you reserve and staff by county, you'll overstaff the quiet side and run short on the side that got hit. The footprint is the thing that corrects for that.
Where the boundary comes from
Most carriers start with NWS storm reports, wind speed estimates from the National Hurricane Center or local forecast offices, and sometimes a hail swath layer if convective wind was part of the event. That gives you a modeled footprint: a reasonable first guess at where damage happened, built before anyone has looked at a single roof.
The modeled footprint is useful for day-one reserve setting. It is not the same thing as an observed footprint, and the gap between the two is exactly where adjuster deployment goes wrong. Wind doesn't respect a smooth gradient. Tree cover, building age, a ridge line, a construction detail that makes one subdivision hold up and the next one lose every third roof. The modeled line says "moderate damage expected here." The ground, or the imagery, says something different block by block.
A catastrophe footprint boundary built only from the modeled wind field will put adjusters in neighborhoods that look fine and leave the hardest-hit streets waiting. That's the failure mode everyone on a cat team has lived through at least once: trucks dispatched off the model, a week burned, and the worst claims still sitting in the queue because nobody had eyes on the ground to know they were the worst.
Turning the footprint into a deployment plan
Fixing this isn't about building a better model. It means replacing the modeled guess with an observed one as fast as the imagery allows, then using that observed footprint to rank the buildings inside it, beyond simply confirming the boundary. A storm footprint map that shows "moderate" and "severe" zones is a start. A footprint where every structure inside it has been graded against what happened to its roof is the thing you can route adjusters off.
That's the gap Windstorm Damage is built for: grading every building inside the storm footprint from very-high-resolution imagery within days of the event, so the worst-hit buildings get an adjuster before the model's best guess sends one somewhere else. GSD at half a meter or better is fine enough to separate a torn-off section of shingles from a fully stripped roof, which is the difference that drives a reserve number up or down.
What this changes for the reserving conversation
Once you have an observed, graded footprint instead of a modeled boundary, two things happen. First, reserves get set against buildings you can see damage on, not a county-level loss ratio pulled from the last comparable storm. Second, deployment stops being first-come-first-served inside the affected area and starts being worst-first, because you know which blocks are worst before a single adjuster has driven there.
None of this replaces the adjuster. Someone still has to walk the roof, open the attic, write the estimate. What it replaces is the week of driving around guessing which street to start on, and the self-reported photos that come in slow and skew toward policyholders who know how to make a claim look bad enough to jump the queue.
If your next cat event footprint still means "the counties the model flagged," it's worth looking at what a graded, per-building version of that boundary gets you before the trucks are already moving.